WordPress Debug Constants Explained
WordPress has a handful of PHP constants that control how errors are reported. They all live in your /wp-config.php file, and most WordPress developers never touch them. That’s usually fine until something breaks and you have no idea why.
But one of these constants has a security problem that most people miss entirely.
Why is WP_DEBUG_LOG a security risk on live sites?
This is the one that catches people out. Setting WP_DEBUG_LOG to true writes PHP errors to /wp-content/debug.log, and that file is publicly accessible by default. Anyone who knows the path can read it. Worse, Google has already indexed thousands of them.
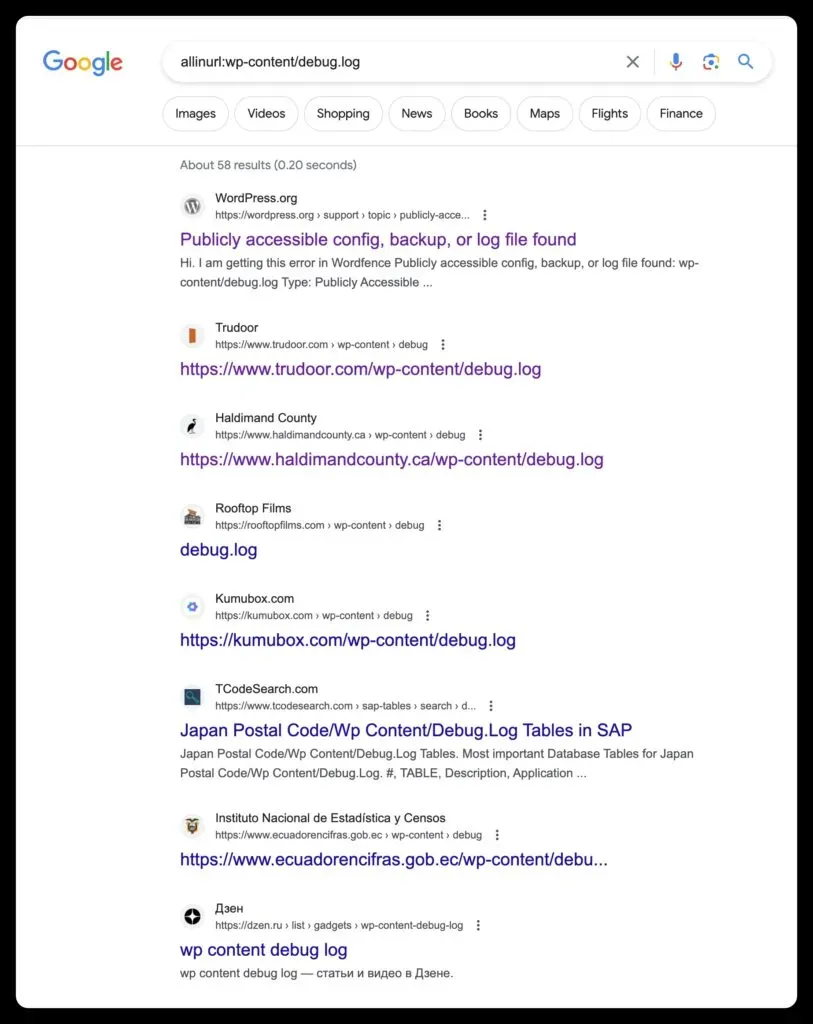
These log files can expose database credentials, file paths, plugin internals, and other details that make an attacker’s job much easier. If your site has WP_DEBUG_LOG set to true in production, fix it now.
The fix: pass a custom, hard-to-guess filename instead of true:
define( 'WP_DEBUG_LOG', 'myOwnRandomFileName_as8f6safsif.log' );Now nobody can guess the URL. The log still works, but it’s not sitting at a predictable path waiting to be found.
If you’re worried that your debug log has already been exposed, run a suspect content scan to check for any signs of compromise.
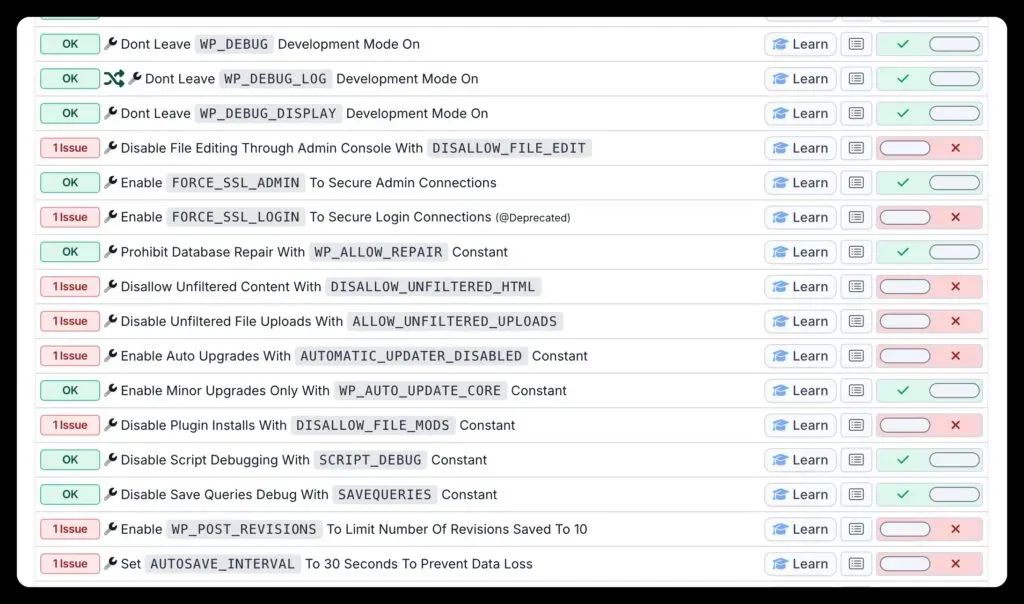
The WordPress debug constants
Here’s what each one does and when to use it. The official docs are at WordPress.org’s Advanced Administration Handbook if you want the full reference.
WP_DEBUG
The main switch. Set it to true and WordPress will show PHP errors, notices, and warnings on screen.
define( 'WP_DEBUG', true );Leave this on in development, turn it off in production. Simple.
WP_DEBUG_LOG
As covered above, this writes errors to a log file instead of printing them on screen. Useful for production sites where you don’t want visitors seeing PHP warnings, but never set it to true on a live site. Always use a custom filename.
define( 'WP_DEBUG_LOG', 'myOwnRandomFileName_as8f6safsif.log' );WP_DEBUG_DISPLAY
Controls whether errors show on screen. Set to false on live sites so errors get logged but visitors don’t see them.
define( 'WP_DEBUG_DISPLAY', false );SCRIPT_DEBUG
Forces WordPress to load the full, unminified versions of its CSS and JS files instead of the minified ones. Handy when you’re debugging front-end issues and need to actually read the source.
define( 'SCRIPT_DEBUG', true );SAVEQUERIES
Stores every database query in $wpdb->queries so you can inspect them. Good for tracking down slow queries, but leave it off in production because it adds overhead.
define( 'SAVEQUERIES', true );Checking WordPress debug constants across all your sites
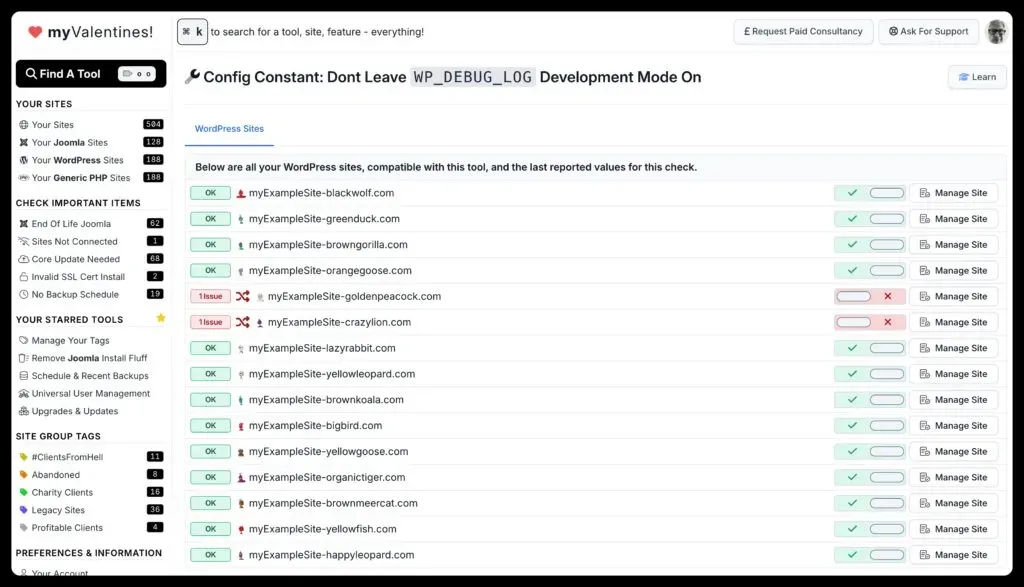
Manually checking wp-config.php on every site gets old fast. The mySites.guru snapshot reads your WordPress config and flags anything that doesn’t match best practice. Most settings have one-click toggles so you can fix them without editing files. The same one-click approach works for other WordPress configuration checks, like removing the WordPress logo from the admin bar, disabling automatic updates, and cleaning up leftover default content.
You can also view any single constant across all your connected sites at once using the Ultimate Toolset. Click through any snapshot tool to see that value on every site in one view.
For a broader look at hardening your WordPress and Joomla installations, see the WordPress and Joomla security guide.
Need someone to fix it for you?
If debugging isn’t your thing, or you’d rather not deal with it, we offer set-fee site fixes at fix.mysites.guru. No hourly billing, no surprises.

Can you try mySites.guru free for a month?
We haven’t raised our prices since 2012. But if you want to see the toolset for yourself first, you can use mySites.guru free for a whole month.